A few months ago, we published an article covering the benefits of Facebook Attribution tool. We pick up from there and bring you more tips on how to fully utilise all the valuable insights and reports that are available for free in your Business manager, and that can take your campaigns to the next level.
Since the data are essential for every marketer in the strategic decision-making processes, viewing them in the right way is crucial. Let’s find out where to dig for different reports.
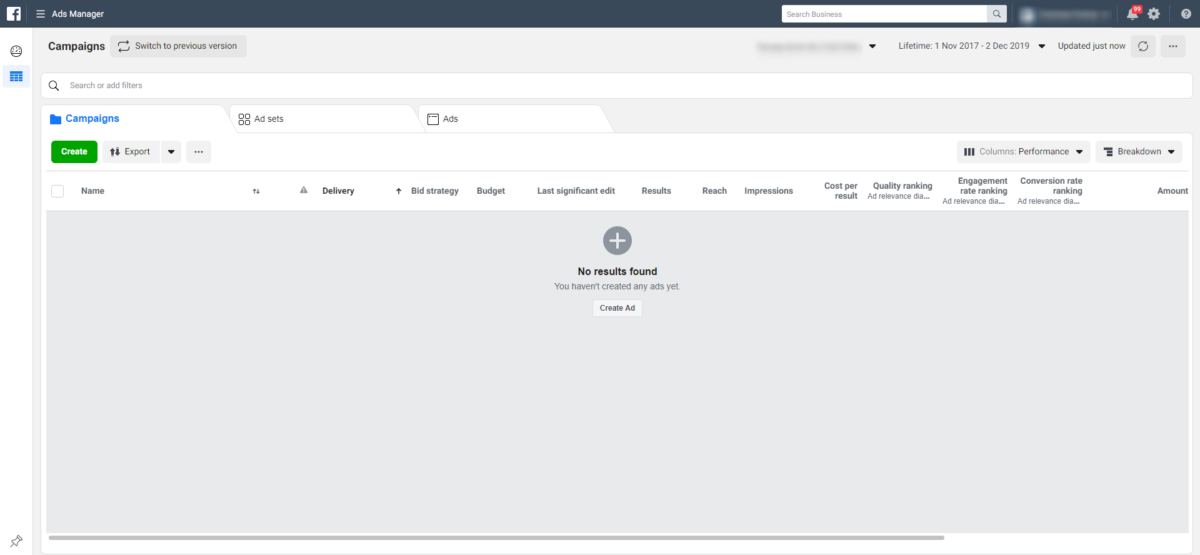
Breakdowns & Ads reporting
In your Ads Manager, you can analyse each campaign, target group or ad, based on different criteria like, age & gender, region or impression device. If you’re looking to view data for the whole account, it is better to go to Ads Reporting where you’ll be able to opt-out of the campaign or adset name and focus on the breakdown you’re most interested in. It can be, for instance, breakdown by country to see in which countries your ads and your product are resonating more or breakdown by impression device, or by conversion device to see the most frequent customer journey.
If you’re running mostly video ads, you might be interested in using the performance of each placement as a break down (Facebook feed, IG feed, Stories, Audience network etc.) and also average viewing time in each of these placements.
What’s really handy about “Ads Reporting” is that you can save these reports and come back to them whenever or just generate a link and send it straight to your client.
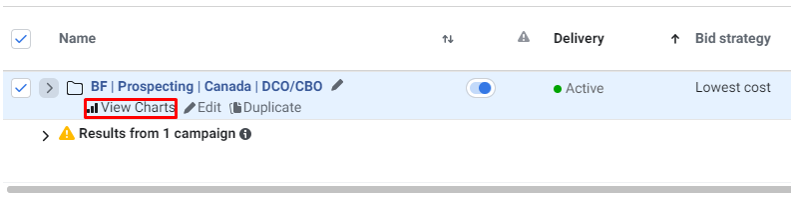
View charts & Inspect
The quickest option to visualise campaign data is to use the View Charts option you can find under each campaign or adset.
Here, for instance, you will be able to see how CPA and reach change across different age and gender groups.
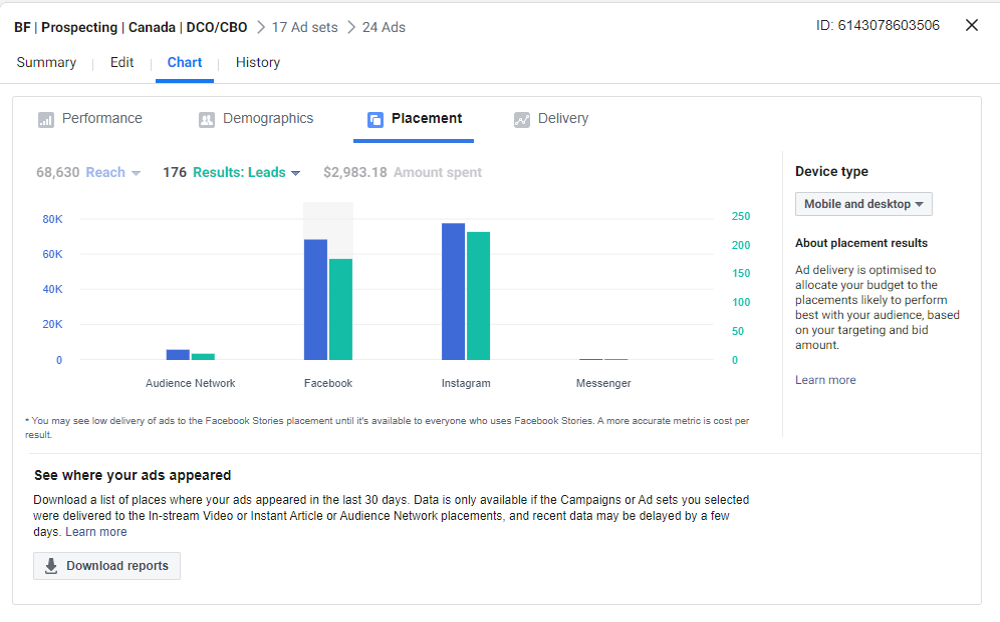
If you go to the Placement tab, there’s an overview of data for each platform within the Facebook advertising. Moreover, if you’re concerned about your brand safety, here is also the place where you can download and go through all the domains where your Facebook ads were displayed as part of the Audience Network placement.
The View Charts option is also available on the adset level but let’s look at the Inspect option which is more detailed and therefore more exciting.
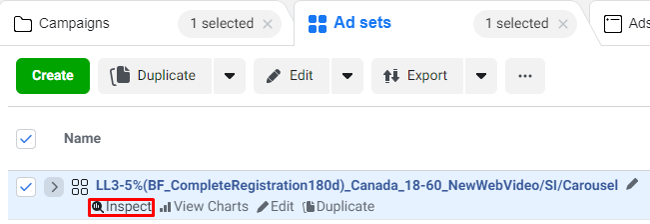
When you click Inspect on the right side of the screen, a report opens. Here you will be able to see several different charts visualising your adset’s performance in time:
1. Overall performance chart
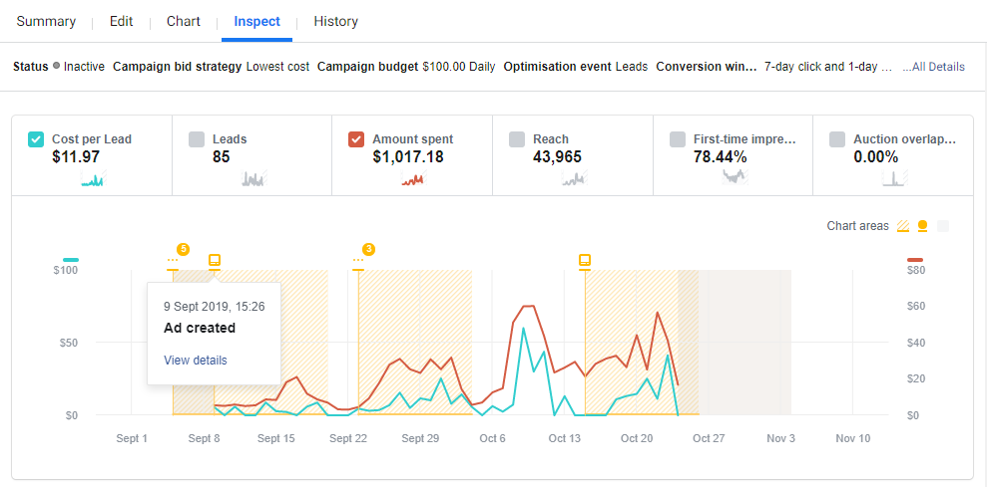
This visualisation helps you understand how each change in your adset or ad affects your delivery and results with yellow areas showing the duration of the learning phase of the algorithm and yellow lines marking each change. This chart is also handy for you to see how your budget changes on the adset level affected your costs in time.
2. Auction competition chart
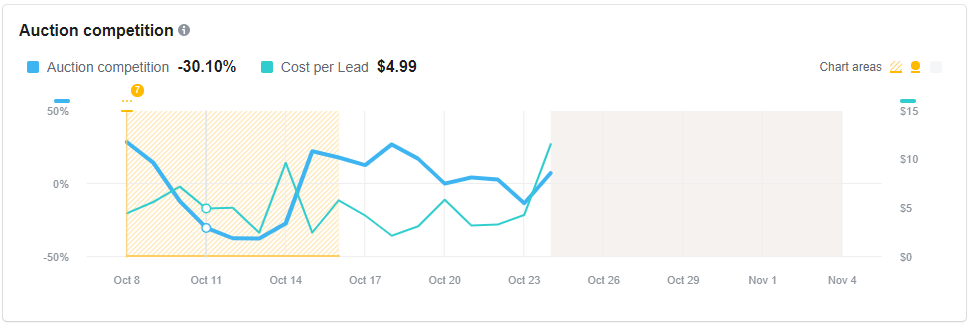
This is a fascinating chart as it shows the competition for a particular adset in time as a percentage. The blue line indicates by what percentage was the competition higher or lower than the average for a given date. For example, if you hover over October 11, you’ll see that the auction competition for that day was by more than 30% lower than average. Towards the second half of October, the competition has been rising which could be linked to the upcoming Black Friday promotions and also holiday season campaigns.
From this chart, you will also be able to determine if the rising costs of your Facebook campaigns might be linked to the rising competition. According to Facebook, high competition is any number beyond the datapoint 20%, and in the same way, a datapoint of -20% and less indicates low competition. The competition marked by a percentage between these two numbers indicates stable competition and seeing rising costs within this range is unlikely to be related to the competition.
3) Audience saturation chart
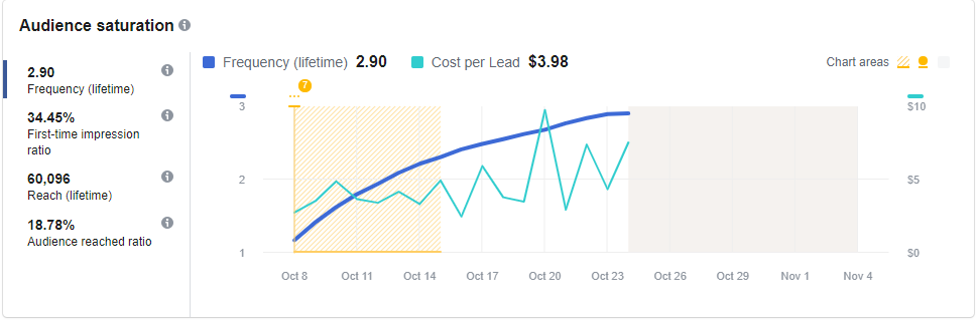
If you are concerned about your ad’s frequency and its impact on performance, make sure to scroll down to this chart. If your adset cease to deliver ads to new users, the audience is becoming saturated, and performance can therefore decline. This phenomenon is also visible in the chart above, where we see that Cost per lead is rising with higher frequency.
To avoid the ad fatigue due to the high saturation of your target group, you should consider to broaden the audience or test a new one.
4) Auction overlap chart
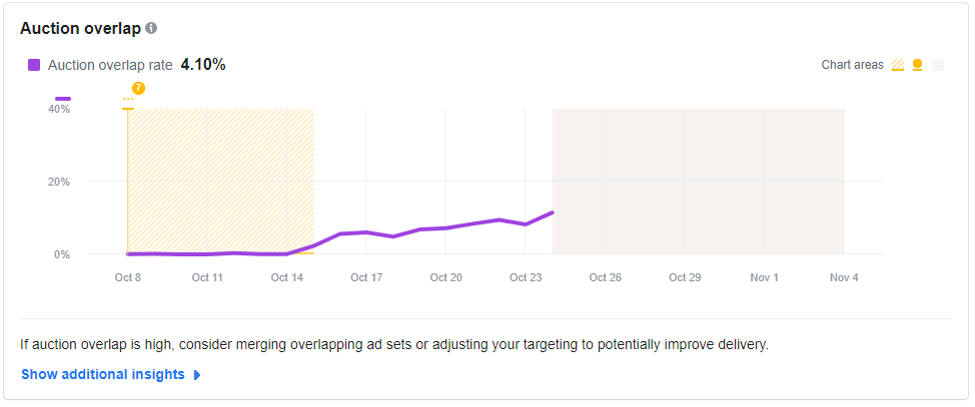
In the last part of the report, there is an auction overlap chart where you can monitor how often your adset ended up in an auction together with some other adset from your ad account. This can happen if:
- You are not excluding your audiences properly
- You are targeting very close interests
The ideal rate would be 0 as you do not really want to bid against yourself, but unless you don’t surpass 20-30% there shouldn’t be any significant rises in costs. If your overlap is for instance 60%, make sure to pause the underperforming adset or consider merging the overlapping target groups as with this percentage of overlap your adset structure is not effective. In Show additional insights, you’ll be presented with the list of the adsets there was an overlap with.
Test and Learn
To keep better track of things you have tested in the past, be sure to visit Test and Learn in Business Manager. Here you can view all of your Split test neatly ordered. Here you can also find all the Brand Lift or Conversion Lift studies you run along with their results.
Facebook Analytics
This is a well-known place within Business Manager that every Facebook marketer visits at least once a day. Some of you might also want to try the Facebook Analytics app, which is handy as you can create reports on-the-go. Let’s look at some ideas on how to use Analytics:
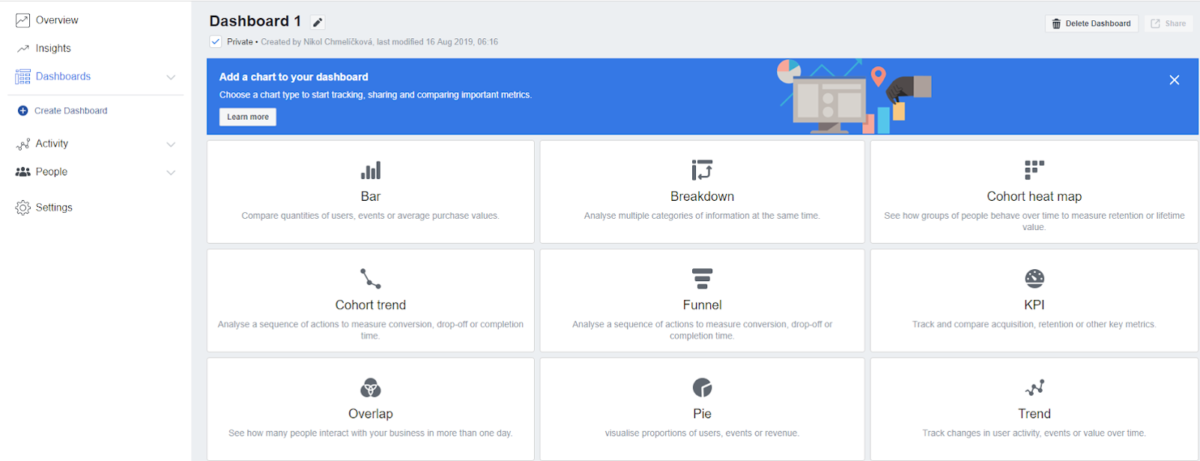
Customised reports
If you’re tired from downloading the data from Facebook and then format them and then visualise them, you can avoid it by creating customised dashboards. This really saves time and your nerves.
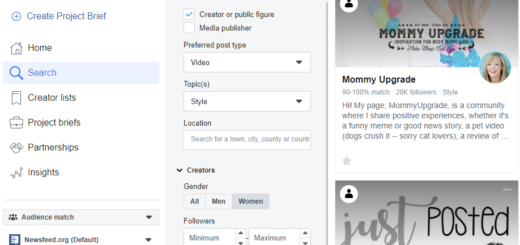
Audience insights
Another interesting tool, especially when trying to find out more details about your target audience, is Audience Insights. Here you can get a grasp of which topics your Page fans are interested in or what demographic layout has your target group with a given interest in a given country.
Creative reporting
Last but not least, there is an account overview section within the Ads Manager where besides the general statistics of the account, you’ll find a performance report broken down by creative assets.
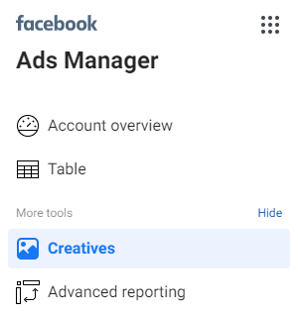
This report enables you to view and compare the performances of each video, banners, collections or any other creative assets.
Did you enjoy my article? Share your main takeaway in the comments below.