Dynamic Language Optimization (DLO) is a Facebook feature that enables you to target international markets with your campaigns. Powered by Facebook’s algorithm and ML, the DLO functionality enables you to precisely show ads in a relevant language of your target audience. Read more to find out how DLO boosted performance in our 2 A/B tests.
Right now Dynamic Language Optimisation is available with these objectives:
- Reach
- Brand Awareness.
- Video
- Traffic (website)
- App installs
- Conversions (website)
DLO allows you to have 1 campaign with 1 ad set and 1 ad personalised to different languages leaving the delivery of the language variants on the Facebook algorithm. This feature solves both the issue of language relevancy and also time effectiveness when creating your campaigns.
How to set up an international campaign with Dynamic Language Optimisation
After you have your campaign and ad set ready, head over to the ad set level. At this moment, DLO works with these types of ads:
- Single image
- Single video
- Slideshow
After you have chosen your desired ad type, you simply select “Create In Different Language” to start designing your DLO ads:
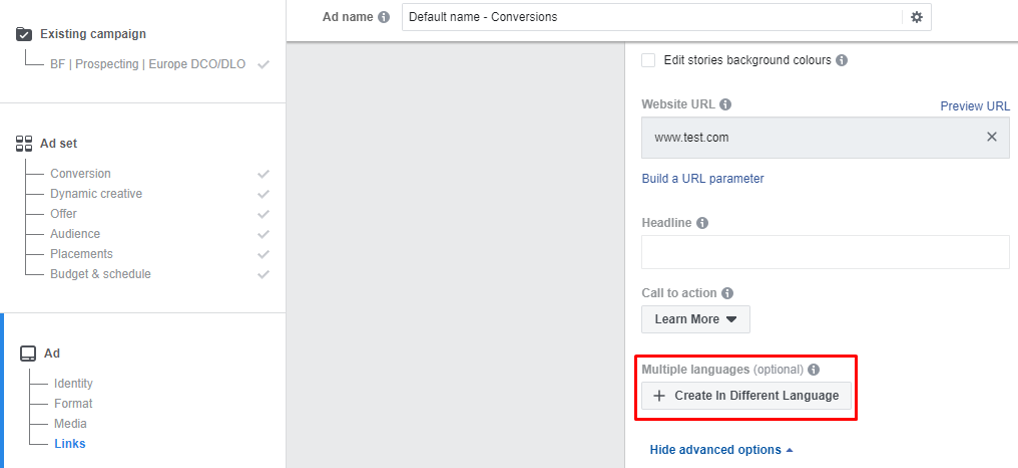
After you click on the creation button you will be asked to select your default language. This basically means that you decide which language will be shown to people speaking a different language that is not included within your language variations. After that, you can add other languages and creative assets. In fact, you can add up to 48 language variations in one ad:
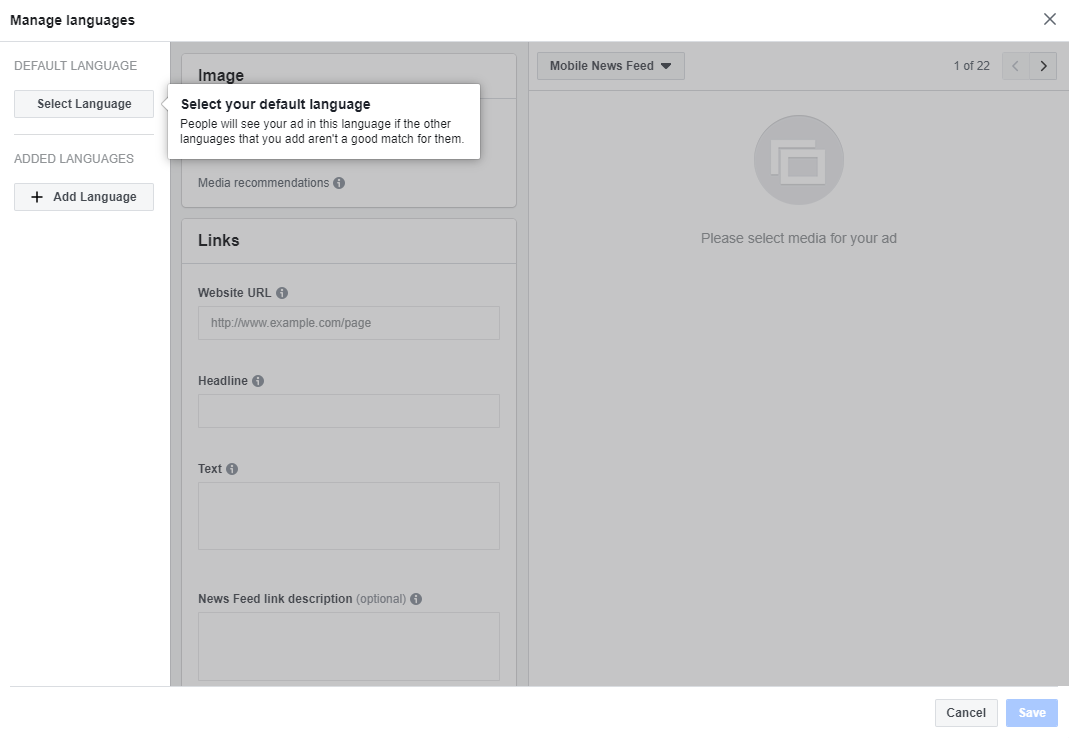
For each of the language variations of your ad you can choose different
- Visual
- Copy
- Headline
- Newsfeed description
- URL
It is also important to keep in mind that if you decide to use DLO you should also deliver the same language experience on the landing pages. In fact, 57% of global online shoppers agree that they would not feel comfortable buying from foreign websites that are not in their own language*. So make sure your ad in Spanish does not, for instance, lead to an English landing page.
Dynamic Language Optimisation vs. Dynamic Creative Optimisation
We tested this feature against the client’s best-performing ad sets at that moment. However, it is important to keep in mind that there were more variables coming into this test as we were testing Dynamic Language Optimisation against Dynamic Creative Optimisation. On the other hand, the results have definitely shed some light on DLO’s potential. Here are the test results:
TEST 1:
Objective: Conversion
Target: All 18-65+
Optimization: Lead (new user in the platform)
Conversion window: 7 days after clicking and 1 day after viewing
Targeting: Interests
Placement: Automatic
Test duration: 14 days
Attribution: Default
Results:
|
DCO – English |
🥇DLO – with 10 languages |
|
|
Budget |
304 USD |
306 USD |
|
Leads |
60 |
72 |
|
CPL |
5.3 USD |
4 USD |
|
CTR |
0.5% |
0.71% |
DLO campaigns generated 20% more leads than the DCO ones, and the CPL was 25% cheaper with both types of campaigns having the same budget. The CTR may suggest that people were more engaged with a copy in their own language than seeing ads in English.
TEST 2:
Same setup as above except for the different Interest targeting.
|
DCO – English |
🥇 DLO – with 10 languages |
|
|
Budget |
301 USD |
300 USD |
|
Leads |
29 |
58 |
|
CPL |
10.82 USD |
5.03 USD |
|
CTR |
0.47% |
0.7% |
The number of leads generated by the DLO campaigns twice as many the DCO campaign did and it cost 50% cheaper. Again, the CTR suggests that users were also more engaged when seeing DLO ads.
This rather complex testing of this feature showed that DLO can deliver great results internationally. If you’re looking for an exact comparison, you would probably want to put this feature under a split test with another campaign targeting each country separately.
Assessing the performance of each language variant
You can view your results by using the breakdown feature in Ads manager or in Ads Reporting in Business Manager. Use the breakdowns by “country” or “creative assets” to see which countries performed best and how people reacted to each visual.
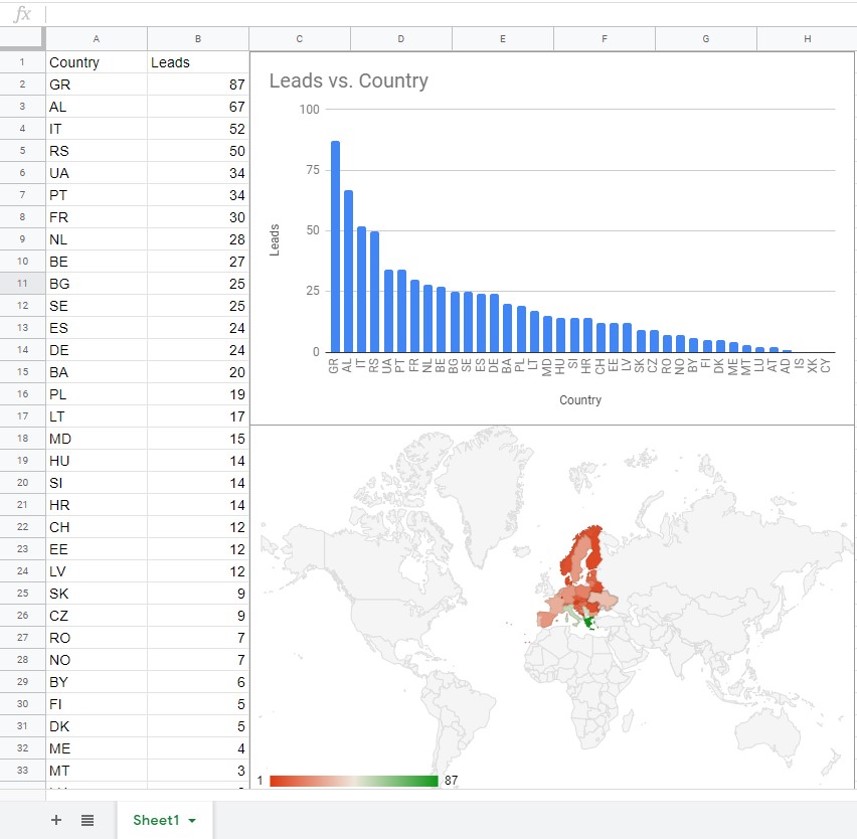
If you prefer to visualise data from each country for better demonstration, simply use Ads reporting and create a graph in just a minute following these simple steps:
- Click create custom report in the top right-hand corner and land in Ads reporting.
- Dismiss breakdowns to campaigns/ad sets/ads to visualize data for the whole account and choose to breakdown the performance to countries in a given date range.
- Export the table to .XLS or .CSV.
- Clean your data and create cool graphs you can use in your quarterly presentations:
Have you tried Dynamic Language Optimisation in your campaigns? Share your experience with us in the comments!
* Source: “The Cross-Border Opportunity” by Ipsos & PayPal (Online study of 34,052 people) May 2018


