If you want to have a detailed insight into your Facebook customers’ buying behaviour, and if it’s important for you to know which channels your clients go through before they convert, try browsing omnichannel reports. This is a report that includes data from all facebook channels, such as your site, web, or messenger bot or application. So let’s take a look at what features Facebook Analytics offers in this regard.
What are Journeys reports and why they use them
During this year’s F8, Facebook introduced, among other things, the new Facebook Analytics functionality called Journeys. This feature is something like “Top Conversion Paths” in Google Analytics, but only on Facebook. Journeys can visualise your customers’ conversion paths across different channels. We will now show you tips on what exactly you can read from the Journeys report and how to apply this information for further development of your project.
The most common converting and non-converting routes
Within the Journeys tool, you can see where your customer’s conversion path starts and where it ends. You will see, for example, that a quarter of conversion customers who have interacted with your Facebook page will complete their Android app purchase. If the number of such customers is small, thanks to this information, you might consider improving your UX application.
Which first interaction leads to the most purchases
This information is important for evaluating which channels to pay special attention. For example, you can learn more about creating content on your Facebook page as a channel with the most converting sessions, or rather try to hit people with a separate acquisition campaign targeting only the iOS operating system where most customers start the conversion path.
Which conversion paths have your audience’s most frequently selected segment
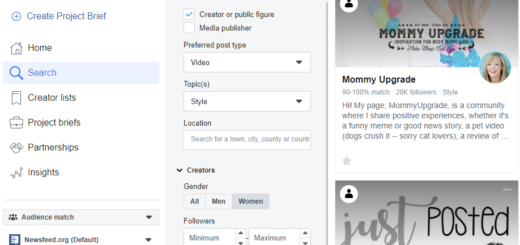
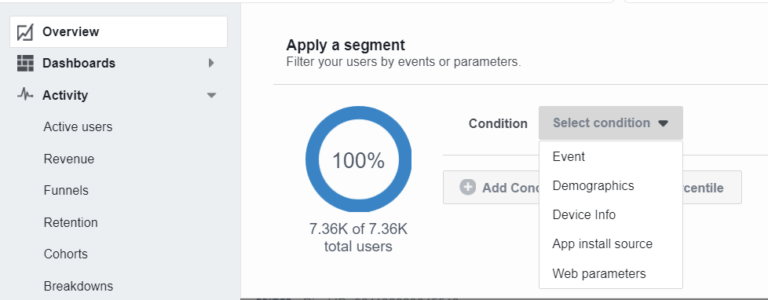
As well as across Facebook Analytics and Journeys, you can filter out a segment of your audience. For example, you can see if people with a particular mobile operator are more conversational on your site. At present, however, it is only possible to elect from several foreign mobile operators, which can be used when analyzing foreign markets. You can also segment the web event, demographics, device type, application installation source type, and site parameters (see figure).
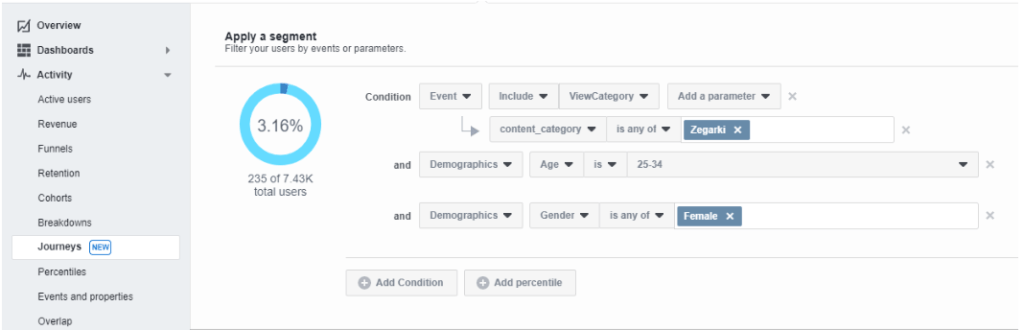
The terms of your segment can be combined to create, for example, a segment of 25-34-year-old women who saw the watch category on your site. For this segment, you will create a route visualization with one click. With this graphical view, you’ll be able to better optimize your ad placement for your audience.
Another important item for segmentation is the “Add percentile” option, which allows the filtering of a certain percentage of people according to the event on your site. For example, you can filter out the top 5% of the customers who spend the most money with you, or the top 25% of the customers who most often buy.
Conversion over time
The ability to monitor the data development over the time is a standard feature in Business Manager and it is the same for Journeys. Not only you can see how, for example, the number of sessions on your facebook page changes along with the number of conversions, but you can also see how long it takes for your customers or customer segment until they convert. This will allow you to better plan the sequence of individual ad campaigns in different channels.
Where to find Journeys and how to set them up correctly
You can find Journeys in the menu on the left. At this point, Facebook’s functionality is still improving and it is possible that the algorithms will be somewhat modified.
How do I set up access to source data correctly?
In order to measure activity across your Facebook channels, you need to create a new “Event source group” for Facebook Analytics:
- Click the menu and select Analytics
- In the top right corner, select “Create event source group”
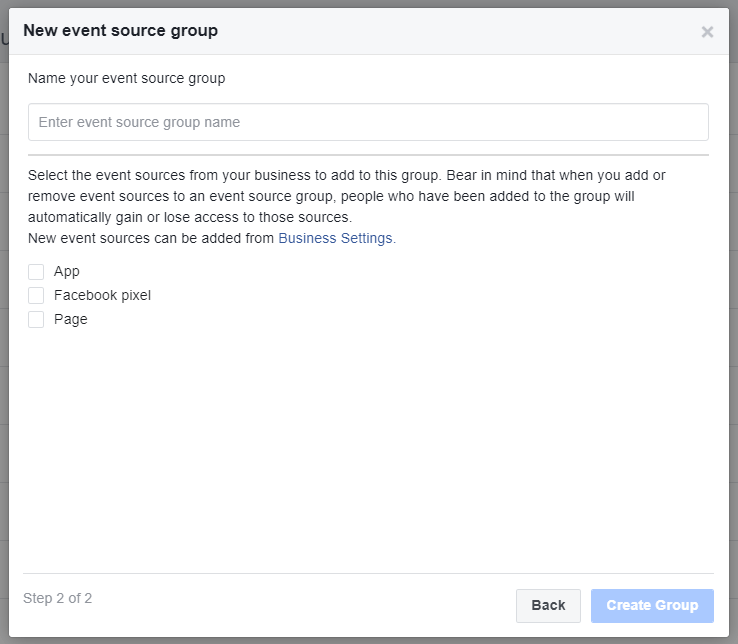
- Select your Facebook feeds from which you want to import the data for your report (see picture) and name your new Event source group.
- Once you have created entity, check in Business Manager if you have access to it, specifically in the “Data sources” section.
- As the last step, select the desired reporting entity in Facebook Analytics and click on “Journeys”. In this interface, you then set the reporting period and the audience segment you want to analyze. Soon you can start analyzing the output.
Journeys in practice
Say we have set these variables for analysis:
- Timeout: 7 days
- Conversion event: Purchase
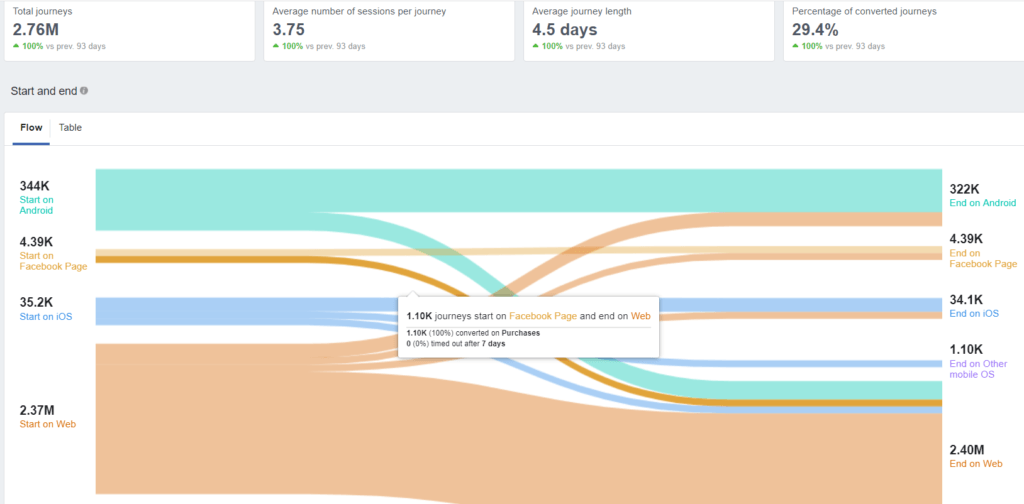
For example, we see that the total number of conversions and non-conversion routes was 2.76 million, and only 29.4% brought the conversion. It takes on average 4.5 days until someone performs a conversion. It is necessary to take into account that we have set routes timeout after 7 days and for some customers, it takes significantly longer before they buy, so this means this group of customers only appear in “non-conversion” routes now..
For illustration, I will give an example. A new customer reviews your products on a mobile browser on June 1. This customer returns to the web on mobile on June 14th and decides to download your mobile app to make it easy to view your products. The customer will then log twice to your app during the day before they decide to buy. Finally, the purchase will be completed at the end of the day on the laptop.
Your customer has completed 5 sessions – 2 on a mobile site, 2 on a mobile app, and 1 on a computer browser. In total, the customer has completed 2 journeys – non-conversion and conversion. The first was a non-converting one because the customer did not buy within 7 days from the first session. The second was a converting-one because it led to a purchase in less than 7 days.
In our example, you can see that a high number of non-conversion routes does not necessarily mean that something is wrong in your funnel, but it brings you closer to your customer’s behaviour on Facebook. Journeys are one of the ways how to better understand your business.
Benefits of omnichannel reports
Facebook Marketing Professionals can manage the Journeys report to outline if the content on the site is selling or not. For business-oriented marketers, it also brings new ideas for creating a strategy, for example, creating a strategy related to the campaign targeting. In general, the main purpose of this functionality is to provide a holistic view of how your customers interact with your Facebook channels. You will then be able to evaluate which part of this platform is your strength or weakness in the conversion path.
Have you tried to create this omnichannel report for your business? Do not be afraid to show us how this feature has helped you analyse your project!