PPC marketers using Google Data Studio to create reports for their marketing campaigns can take advantage of third-party connectors such Supermetrics to automate reporting and monitoring of their Facebook campaigns.
Supermetrics is a powerful connector that allows marketers to automate a very tedious process; the one of manually updating your campaigns. If you are new to Google Data Studio you go through our detailed tutorial on creating reports.
In my previous tutorial, I described the process of creating a Google Data Studio Report with Google Sheet Connector. In this tutorial, I will show you the steps you need to take to create similar a report. with Supermetrics.
Getting started with Supermetrics
There are two ways to create your report. You can either start with gathering the data in Google Sheets via the Supermetrics connector or you can start with the visual aspect of the report and connect/create your data source when you need to do the connection.
The first case of gathering and filtering your data prior to creating your report is ideal if:
- You have a template you will be working with.
- It’s the first time working with the data and some editing, like filtering, adding formulas, is needed.
- You want to leave the report creation and formatting for last.
Starting the visual aspect of the report first is great if:
- You have no template you will be working with.
- You already have your set of data in place and they share are formatted/filtered in the same way as the report’s data source that will be serving as a template.
- You don’t care about further processing the data as you will be using only the ones you want.
Creating a new report while having the data in place
This is super easy and it will require very little time if you are working with a template. Log into Google Data Studio with your google account. This account needn’t be the account that you use to log into Facebook. Find the report that will serve as a template and open it. On the menu, choose “Copy report” under “File”.
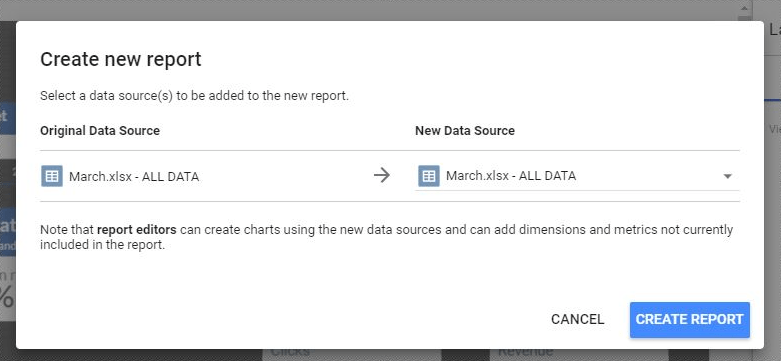
You will be provided with the option to choose the data source that you want your new report to be associated with. Under the “New Data Source” section click on the drop down and choose “Create New Data Source”. Click on the “Explore Connectors” on the navigation menu on the left and add the Facebook Ads connector by clicking on the “Add Connector” button.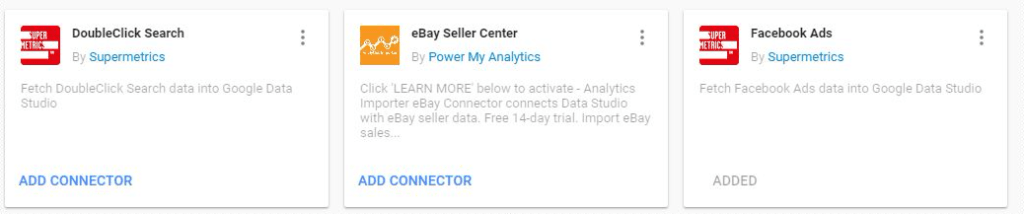
Go through the authorisation process, choose the gmail account that you will be using with Supermetrics (must be the same as with the one that you use to log in to Google Data Studio). Repeat the process for Facebook Ads connector. Have in mind that the Facebook account used must have access to the Ad Account you want to create the report for. Choose the Facebook Account and then click on the “Connect” button in the upper left corner. The connection brings in all the fields that will be used for your report. In the case that you need to rename the data source to a more descriptive name or create a calculated field, you can do so here. Once you are done you can click the “Add to report” button or cancel if you want to choose any other ad account. Now, you can click on the “Create Report” button.
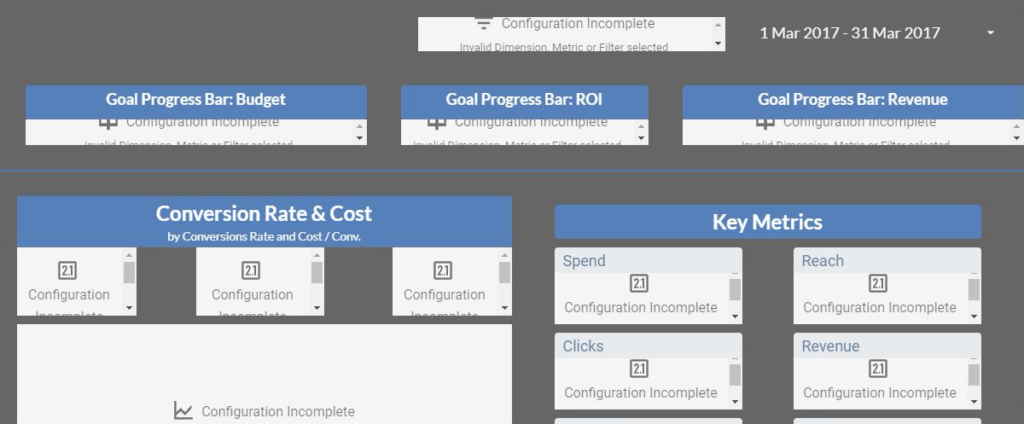
After hitting the create button you might see some errors in your report. Here are some reasons for that:
- Have in mind that if you are using the date range feature with a free Supermetrics account, you will experience such error since you can only report on the last 10 days (or less). Mine is due to the fact that my original report uses a different date range (March) as opposed to last 10 days.
- Other reason might be that the source may not be updated. Be sure to check each element on your report and verify that the source is the one you have chosen.
- Invalid dimension or metric. This is very common if metrics are tied with a date dimension since they are referring to an out of the preferred date range or if you have metrics referencing ads and you haven’t added an ad related dimension.
Creating/processing data prior to creating the report
This step is similar to what we did in the previous tutorial where we used the Google Sheets Connector. Open a blank Google Sheet and head over Add-ons menu, find the Supermetrics option and click on “Launch Sidebar”.
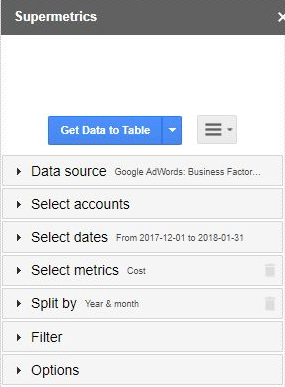
Click on the Data Source and Choose the Facebook Ads Connector. In the case that you are sharing it with your team-members be sure to choose your Facebook Ad Account from the drop-down menu.
Select Account: Here you will find the ad account you want to make the report for.
Select dates: Select the date range that you will be reporting for. In the case that you want to compare to:
- The previous period of the same length
- Same dates a year ago
- Same dates a year ago matching day of the week
- Custom date range
Select metrics: Choose the metrics you want to report on.
Split by: Here you set up the dimensions that you will be using in your report. In the case that you are using metrics that are specific to ads such as relevance score etc. you need to also split by ad name or ID.
Filter: Here you can filter specific campaigns, ad sets or ads. Such filtering can be ideal if you want to report on specific promotions and actions. You can create more advanced and specific reports by utilising any of the other filtering criteria.
Options: Here you can tailor the conversion window to your liking or format your data values for Google Data Studio.
Once you are done, click the “Get Data to Table”.
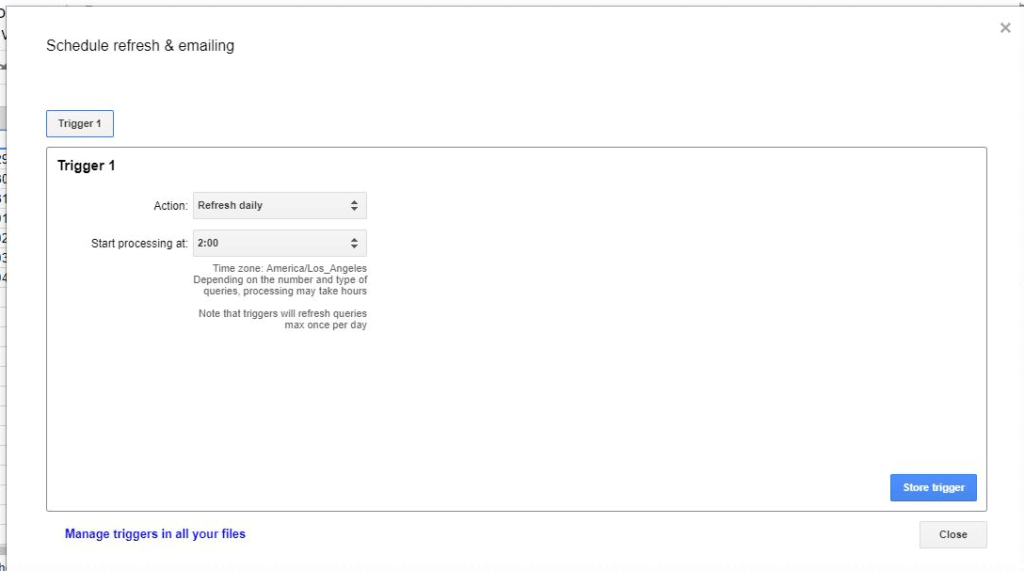
To ensure that your report will stay up-to-date, go to Add-ons, choose “Supermetrics” and then “Schedule refresh & emailing”, and store a daily refresh trigger.
Next, you will log in Google Data Studio go to the Page Settings and Select the Data Source that you want to associate with your report (blank or template). Find the Google Sheets connector on the left side menu and search for the spreadsheet you just created. Choose the appropriate sheet (usually the default one) and click connect. Here you can name the source or create calculated fields or check that the data type is the correct one. Once you are done, click on the “Add to Report” button.
Now you can tailor the visuals to the report to your liking.
And there you have it! An easy way to build cross-channel reports with the help of Supermetrics.