Buffer and BuzzSumo have conducted a detailed survey analysing 43 million posts from 20,000 top brands. The goal was to find out how companies are responding with their strategies to alterations in the Facebook algorithm.
After the changes that Facebook has made to their algorithm this year, many owners and marketers had to find new solutions to make their companies successful on Facebook again. Given the decline in organic reach and Facebook’s emphasis on user interactions in the new algorithm, Buffer and BuzzSumo have decided to conduct a detailed study that ranks as one of the largest in 2018. They examined 43 million posts from 20,000 top brands in the global market. You can read what the results brought in the following points:
1. How often companies have published on Facebook
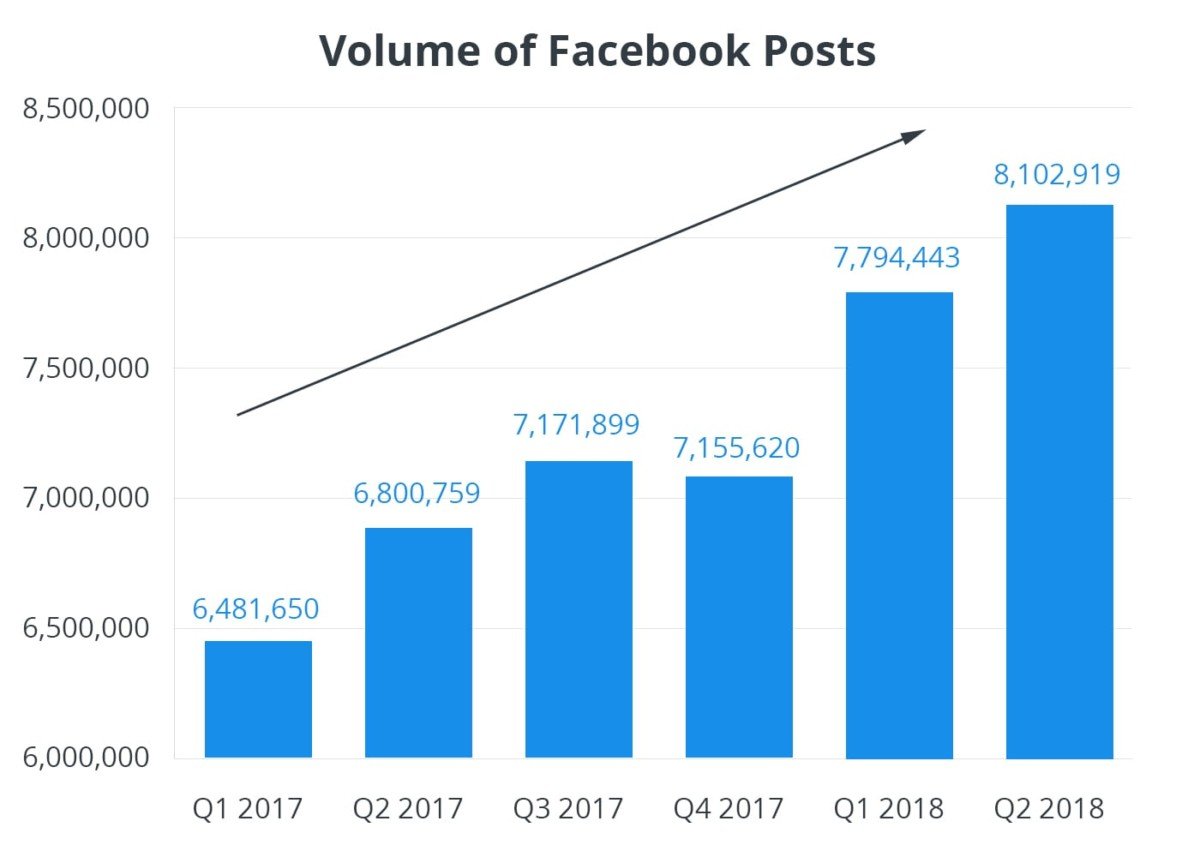
It is very often debated how often companies should publish on Facebook, or what the optimal number of posts is. Each company has a different strategy and each marketing expert has their own proven practices, which are often different. The results of the study show that the number of posts increased by 24% over the course of the previous quarter – from 6.5 million to 8.1 million. In Q1 2017, the company published 72,000 posts per day and in Q2 2018, 90,032 posts per day. This is an increase of nearly 20,000 posts published by well-known brands each day. On average, we’re talking about 135 posts per month per company, which is 4.5 posts per day.
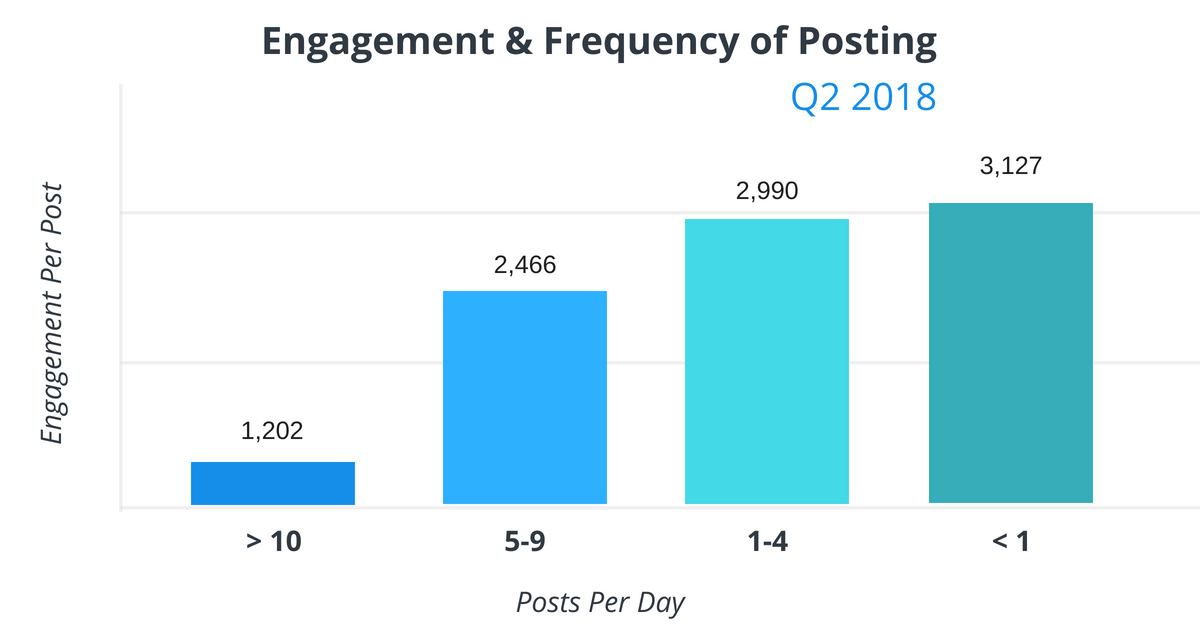
In the following chart, you can see what the best engagement of posts was in terms of publishing frequency per day.
2. Facebook site engagement is decreasing
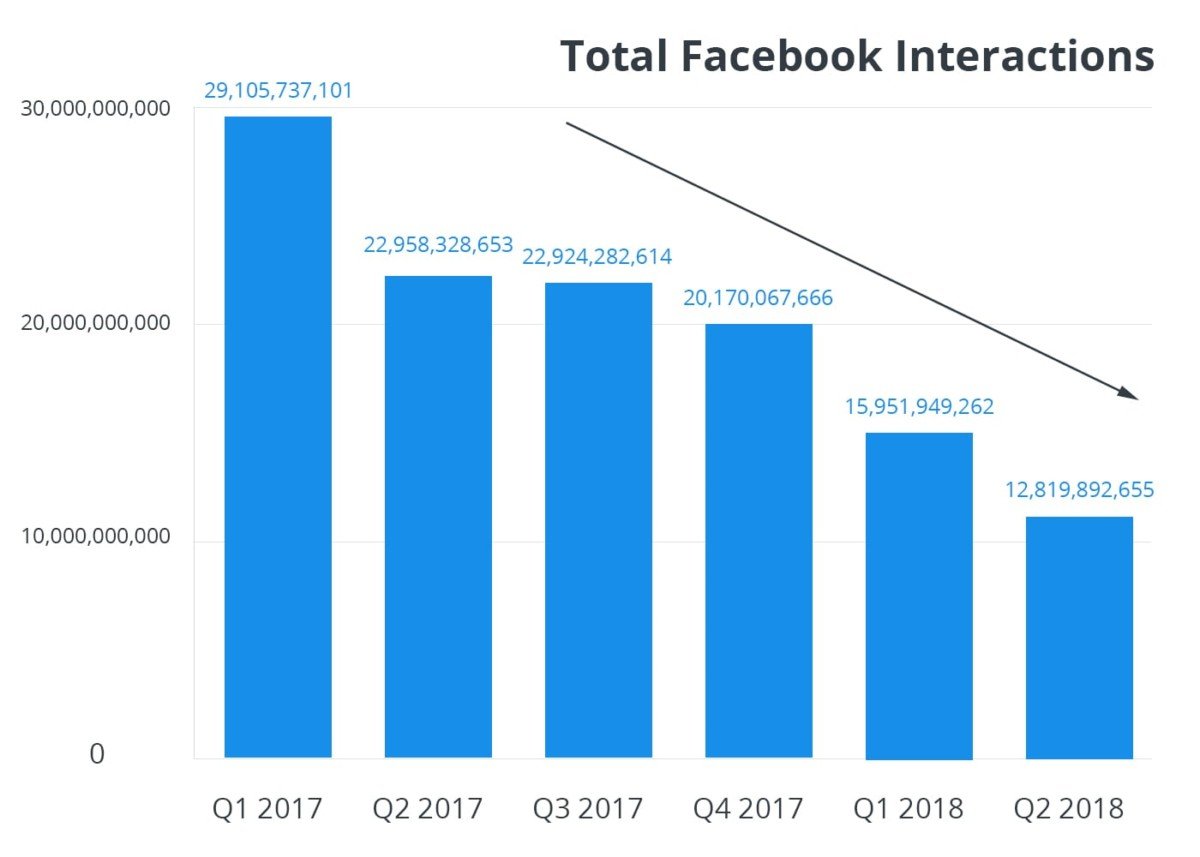
More frequent posting is increasing the amount of content on Facebook, which in turn increases the competition that companies have to break through. The result is lower engagement. Survey results show that over the past 18 months there has been a decline in engagement by more than 50%. In the same timeframe, engagement per post fell by 65% from 4,490 to 1,582.
3. Which kinds of posts were popular
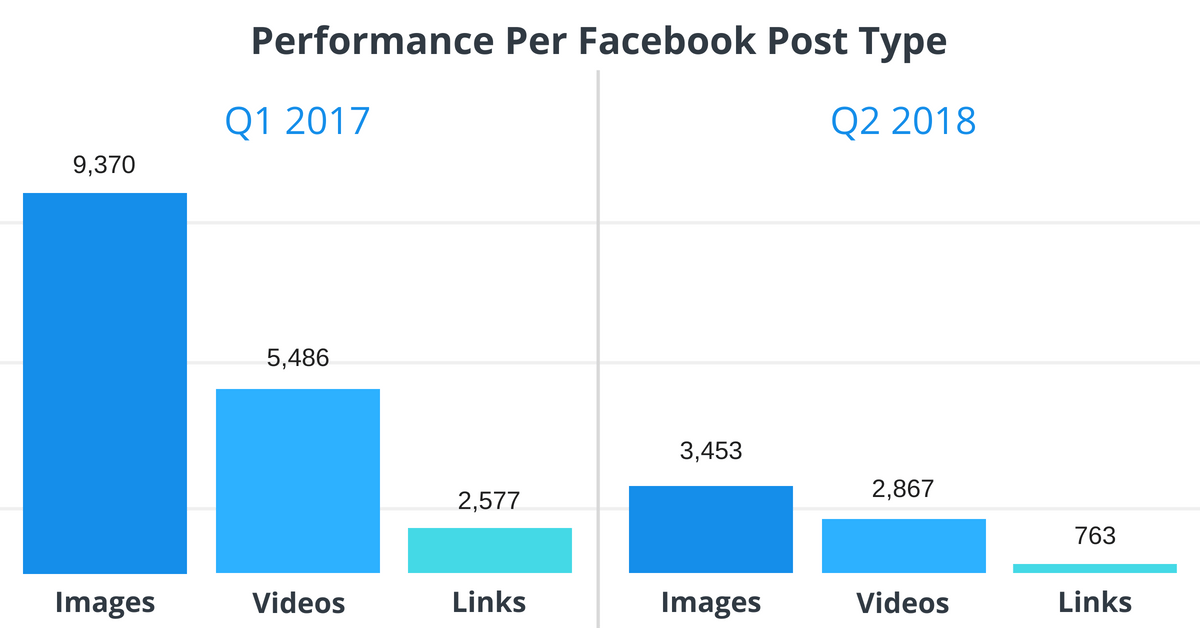
A very interesting result is that images have gained more engagement than videos in analysed posts, which contradicts the trend of the growing popularity of videos. While images were the most engaging compared to other types of posts, compared to Q1 2017, engagement with images dropped from 9,370 to 3,454 in Q2 2018.
Average video engagement declined from 5,486 in Q1 2017 to 2,867 in Q2 2018.
4. What was the decline in engagement by category of Facebook pages
The largest drop in engagement was recorded for artists, films and media/news sites. Facebook page categories still play a key role in the overall success of Facebook marketing strategies.
The results of this research shouldn’t be taken as hard-and-fast rules for all companies; they are an example, representing how 20,000 large companies responded to the Facebook algorithm changes. There is no universal way to be successful on social networks. All business activity and each Facebook page require its own strategy and its own individual approach.
Find the complete results of the report in the following link.


